|
|
Library Survey on Learning Space Planning
In order to collect users' input for the Renovation Project, a library survey was conducted during a 20-day period in March 9-28, 2007. A simple survey with 14 questions was designed. It had both the print and the web versions. The objectives of the survey were to find out users' :
- satisfaction with Library space planning and facilities;
- preference on what facilities to add and cut in the Renovation Project;
- attitude on allowing food and noise from discussion in the Library;
- Library usage pattern.
The survey had 1,583 respondents, representing 5.5% of the total university population of 28,728. It is regarded as a good representation of the university population. As we can see from the user population, 89% of our user population is students, with undergraduates making up the majority of 44%. They have their unique demands on library uses which are reflected in the following findings.
Highlights from the Library Survey:
- The total mean of satisfaction is 4.11 on space plan and 4.18 on facilities, both slightly above “somewhat satisfied” in the 6-point scale.
- Over half of respondents, 58.2%, prefer to add individual study seats.
- About 76.8% of respondents prefer to cut faculty rooms and individual study rooms.
- About 70.7% of respondents agree that light snack should be allowed in a designated area.
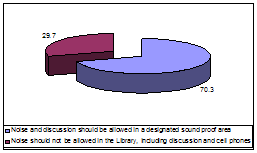
- About 70.3% of respondents agree that noise and discussion should be allowed in a designated sound proof area.
- About 66.1% of users visit the Library either everyday or a few times a week.
- About half of users, 52.8%, spend 1-2 hours in the Library.
- About 34.7% of users visit the Library without a fixed pattern, and 33.3% in the afternoon (2 – 6 pm).
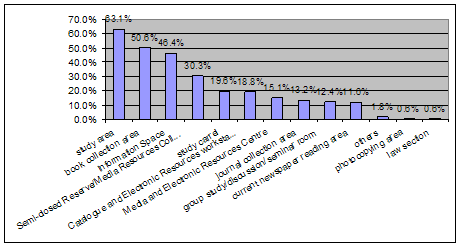
- Study area is the most visited place with 63.1%, while the book collection area at 50.6%, and Information Space at 46.4% follow.
Most users visit the Library to borrow/return library materials, 78.3%, find information, 76%, and study, 74%.
|
 |
Exhibit 1 - Comparison of University User Population and Survey Sample Size
|
University |
Survey Sample |
Full-time |
Part-time |
Total |
% |
Full-time |
Part-time |
Total |
% |
Sub-degree |
6,527 |
395 |
6,922 |
24% |
347 |
20 |
367 |
23% |
Undergraduate |
8,176 |
4,453 |
12,629 |
44% |
642 |
130 |
772 |
50% |
Postgraduate |
1,025 |
4,937 |
5,962 |
21% |
89 |
160 |
249 |
16% |
Student Total |
15,728 |
9,785 |
25,513 |
89% |
1,078 |
310 |
1,388 |
89% |
Faculty/instructors and Staff |
|
|
2,270
945 |
11% |
|
|
45
122 |
11% |
Total User Population |
|
|
28,728 |
100% |
|
|
1,555* |
100% |
*The total number of respondents was 1,583, with 28 users not filling in their status and affiliation.
back to top |
 |
|
Exhibit 2 – Mean Value of the Level of Satisfaction with Library Space Plan by School and Unit


Exhibit 3 – Facilities Users Prefer to Add or Expand in the Renovation
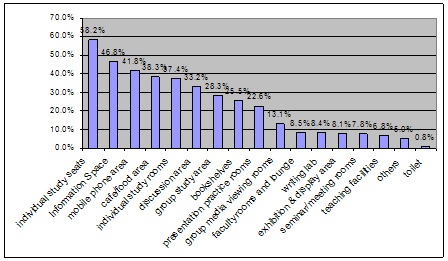

Exhibit 4 – Facilities Users Prefer to Cut in the Renovation


|
Exhibit 5 – Allowing Food in the Library

|
Exhibit 6 –Allowing Noise in the Library
back to top |

Exhibit 7 – Reasons of Visiting the Library
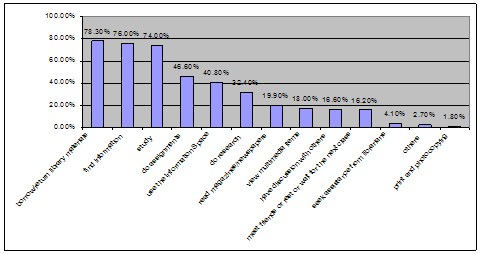

Exhibit 8 – Frequency of Visiting the Library
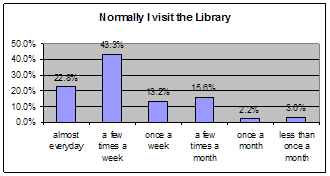

Exhibit 9 – The Time of Visiting the Library by User Groups


Exhibit 10 – The Average Time of Each Library Visit
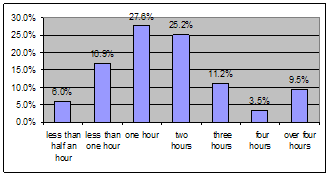

Exhibit 11 – Places/Areas in the Library Normally Used
|


