


|
|
|||
|
|
|
Program TRACK_P 1.0 |
|
This version was uploaded on 27 Aug 2015.
The program calculates track parameters in PADC films (or commercial CR-39 detectors) caused by protons. The program consists of two parts. The first one was written in the Fortran90 programming language without any graphical presentation, and could be compiled and run on any platform. The second one was written in Python script and provided 2-D and 3-D graphical presentations of the proton tracks in the PADC films.
Conditions of use (please read before downloading):
The user will use the program entirely at his/her own risk. The authors are not liable for any loss or consequential damage suffered by the user as a result of any use he/she makes of this program.
This program is a freeware, but publications arising from using this program should cite the following paper:
![]() Nikezic, D., Ivanovic, M., Yu, K.N., 2016. A computer
program TRACK_P for studying proton tracks in PADC detectors. SoftwareX, 5,
74-79.
Nikezic, D., Ivanovic, M., Yu, K.N., 2016. A computer
program TRACK_P for studying proton tracks in PADC detectors. SoftwareX, 5,
74-79.
(A) Program download and installation
Download the program only if you agree to the above conditions of use: Download
The program is distributed as a zipped file called Track_P.zip.
(1) All the necessary files are contained a zip file called "Track_P.zip". Create a new working directory in your root directory. For example, in the present description, we create a new folder called "Track_p" in the E drive. Unzip all files in the "Track_P.zip" file into the directory E:\Track_p.
(2) In the following, we will only describe the procedures for those who only wish to execute the program, since we believe most users will only need this. For those who wish to read/modify/compile/link the files, you need to install any Fortran90+ compiler and perform these actions according to the software shell.
(B) Executing the program Track_p
(1) All the input parameters are included in the Input.dat file. The file contains four lines such as:
4.
8.
1.
80.
which means
(from top):
Proton energy (in MeV)
Etching time (in hours)
Bulk etch rate (in
mm
h-1)
Proton incident angle with respect to the
surface (in degrees)
(2) Change these input parameters as you need and then save the file. Double-click on the Track_p.exe file to run it. The program will ask the user to define the resolution for graphical presentation, i.e., the number of horizontal planes which intersect with the track body and the number of points per one cross section. We recommend "100" for both. A larger number will slow down the calculations, while a smaller number will produce poorer-quality graphical presentations.
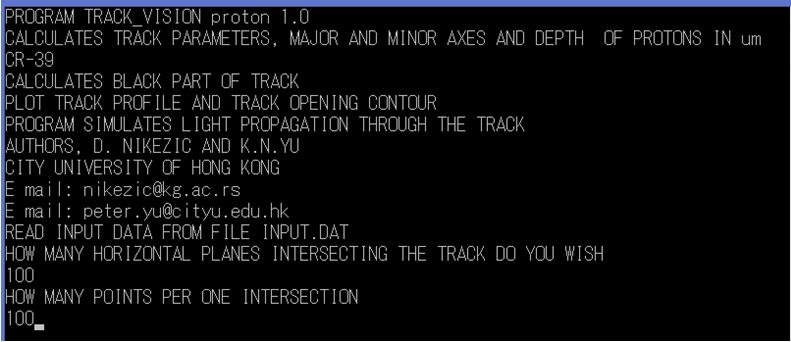
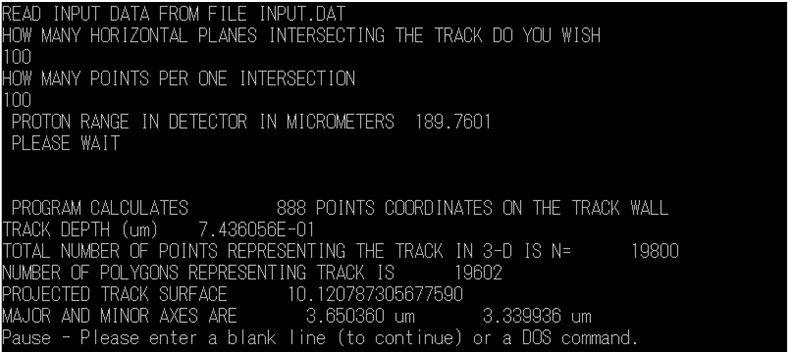
(3) The program will print on the computer screen the track parameters: depth, lengths of major and minor axes and some information about the data used for the computation. The output parameters are also written in the file OutResults.dat.
(4) Press "Enter" to exit from the program.
(C) Track drawing using Python
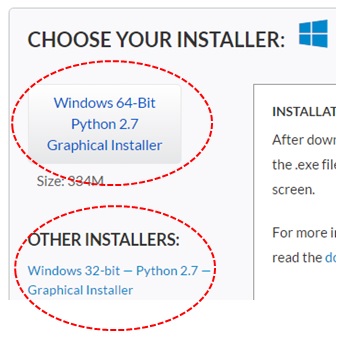
(1) You need the Anaconda Python for this part. If you have not installed this on your computer previously, you have to download the Anaconda Python distribution from http://continuum.io/downloads (choosing Python 2.7 32-bit (or 64-bit) Graphical Installer according to your computer). Install Anaconda using default settings.
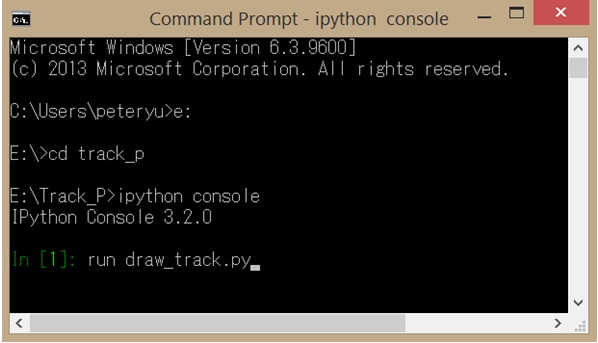
(2) Open a command prompt. (In Windows 8, point the mouse to the top right hand corner and select "Search", type "cmd" in the search box, and then choose "Command Prompt".) Go to your directory E:\Track_p
Invoke the IPython console by typing "IPython console" at the command prompt E:\Track_p>.
Type: "run draw_track.py" and wait.
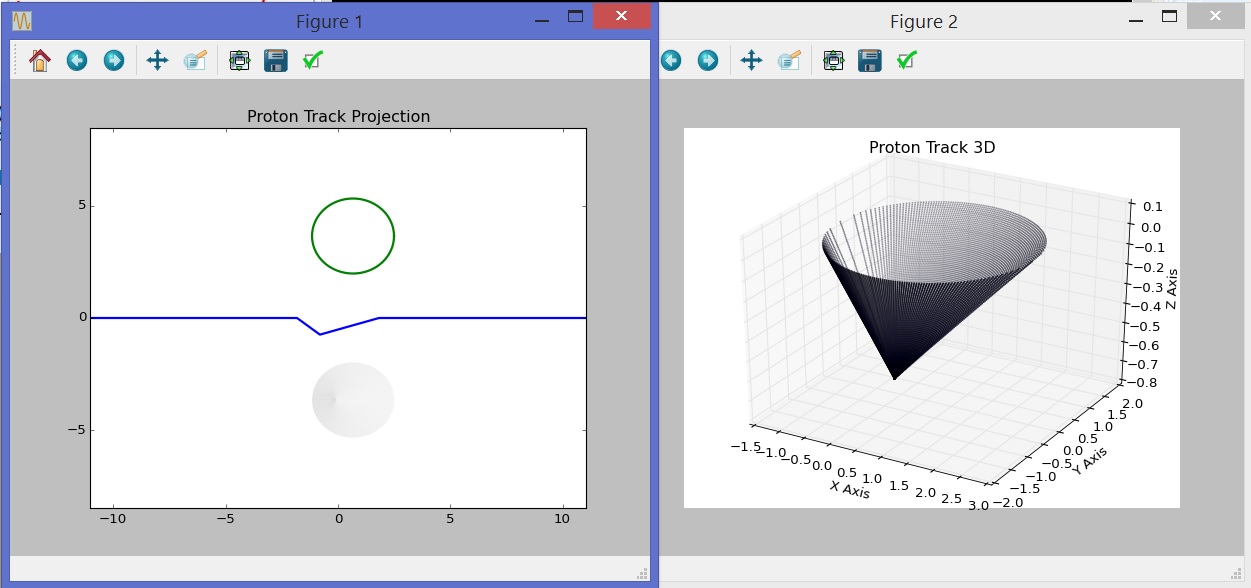
(3) Two separate diagrams are generated (they will overlap with each other on the screen so you need to drag them apart).
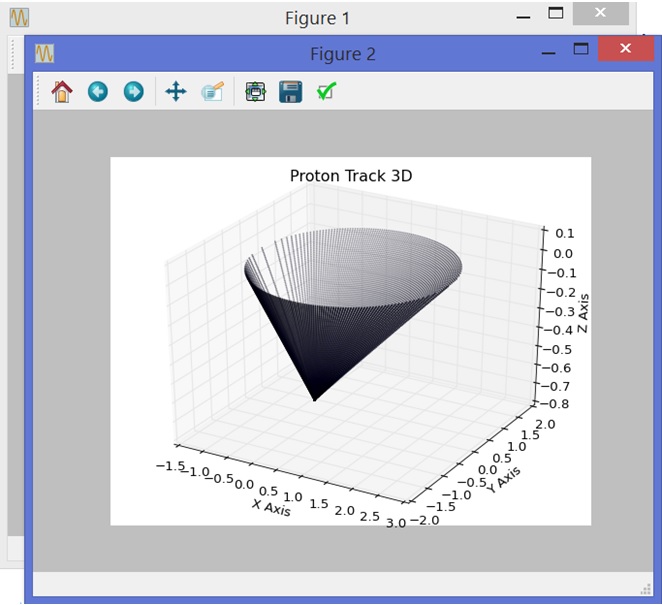
The first one (Figure 1) represents the projection of the proton track in 2D, while the other (Figure 2) shows the projection of the same track in 3D.
Technically speaking, draw_track.py just reads the PROTON_TRACK outputs contained in the files TRACK_COORDINATES.DAT, Contour.dat, BE.DAT and 3_D.DAT and visualizes their contents. The script is compatible with both Python2 and Python3 and has been tested with Matlotlib version 1.4.3 on both Windows and Linux.
If you have comments or need help, please contact D. Nikezic (nikezic@kg.ac.rs) or K.N. Yu (peter.yu@cityu.edu.hk).

|
Nuclear Radiation Unit |
Page last modified on 3-July-2017 Privacy Policy - Copyright - Disclaimer
|