|
Verification of Forecasts of Tropical Cyclone Activity over
the Western North Pacific and
Number of Tropical Cyclones Making Landfall in South China
in 2009
|
1. Introduction
|
|
Issued on 29 Jan 2010 |
Since 2000, City University of Hong Kong has
been issuing real-time predictions of the annual number of tropical cyclones (TCs)
affecting the western North Pacific (WNP). Verifications of the predictions
have shown that the predictions are mostly correct within the error bars. We
also began in 2009 to predict the number of TCs making landfall in South China.
These are all statistical predictions with
predictors drawn from a large group of indices that represent the atmospheric
and oceanographic conditions in the previous year up to the spring of the
current year. The most prominent ones include the proxies for El Niño/Southern
Oscillation (ENSO), the extent of the subtropical ridge, and the intensity of
the India-Burma trough. Details can be found in Chan et
al. (1998, 2001) and Goh and Chan (2009a).
2. Verification of the 2009
forecasts
a. Summary of the forecasts issued
1)
TC activity over the WNP
Our
April forecasts
(issued on 20 April 2009) suggested “near-normal
activity for all the categories”.
The June
forecasts made on 18 June 2009 gave a similar forecast. Detailed numbers
are summarized in
Table 1,
together with the observed numbers based on the warnings from JTWC and the
Tokyo
Regional Specialised Meteorological Center (RSMC)
(Table 2).
Disagreements occurred among the
warning centres on the intensity of some of the systems. Two systems (18W and
25W) were classified by the JTWC as having reached tropical storm intensity but
were not named by the RSMC. Linfa was considered by JTWC as having reached
typhoon intensity but not by RSMC Tokyo. In addition, two TCs (02C and Maka)
formed over the Central Pacific and moved into the WNP.
2)
TC landfall in South China
The April forecast called for a slightly above
normal number of TCs making landfall along the South China coast in the early
season (May to August), a below-normal number in the late season (September to
December), and a slightly below normal number overall. The forecast issued in
June also suggested the number of landfalling tropical cyclones (TCs) to be
slightly below normal for the main season (July to December).
Table 1 shows a summary of these forecasts, along with the observed number
in 2009 and the normal values.
b.
Verification and discussion
1)
TC activity
over the WNP
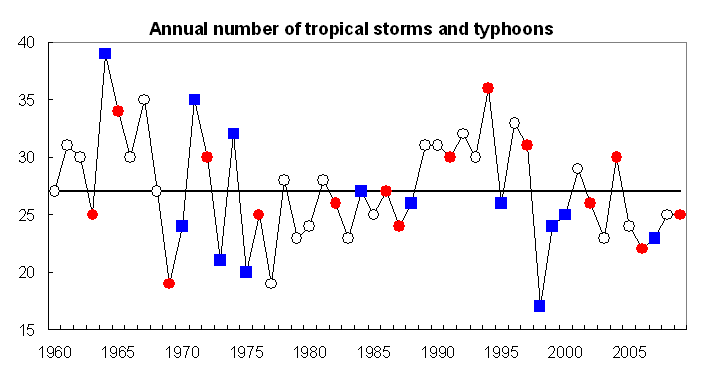
Based on the JTWC warnings, TC activity in
2009 over the WNP was slightly below-normal (Fig. 1), with
25 TCs reaching at least tropical storm intensity and 14 TCs reaching typhoon
intensity (Table 2). The number of tropical storms and
typhoons is 2 less than the normal number (the normal being 27) while the number
of typhoons is 3 less than the normal number (the normal being 17). Our
forecasts from both April and June slightly over-estimated the number of TCs and
the number of TCs with at least tropical storm intensity, but with small errors,
and are therefore considered to be acceptable. However, our forecasts
over-estimated the number of typhoons, the possible reasons of which are
discussed below.
An El Niño event developed in the summer of
2009 and the mean Jun-Nov Niño3.4 index is 0.97. Normally, in an El Niño year,
westerly anomalies are generally found over the eastern part of the tropical WNP,
resulting in an eastward extension of the monsoon trough and hence a higher TC
activity in this region (Wang and Chan 2002). TCs generally have the longer
life span and therefore more chance to attain typhoon intensity (Table
3). This is a main reason for our forecast of the slightly above-normal
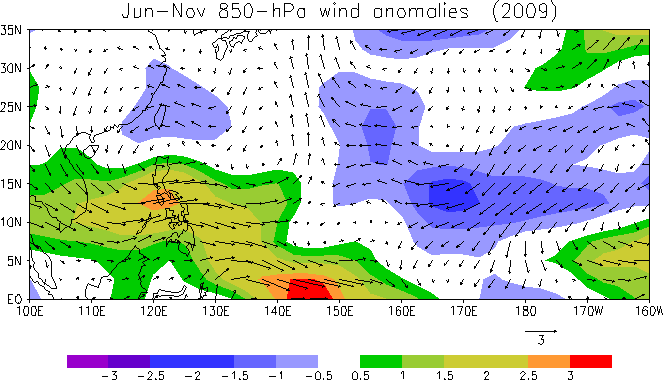
number of typhoons. However, in the 2009 TC season, although the sea-surface
temperatures in the central equatorial Pacific are above normal, easterly
anomalies are found at the low-levels (850-hPa) over the eastern part of the
tropical WNP, with the maximum amplitude near 170oE (Fig.
2) and therefore no eastward extension of the monsoon trough was observed.
As a result, no significant eastward shift in the mean genesis location was
found and only a few storms formed over the tropical WNP east of 160oE,
which is quite different from a TC season associated with a typical El Niño
event. These partly explain the slightly below-normal TC activity especially
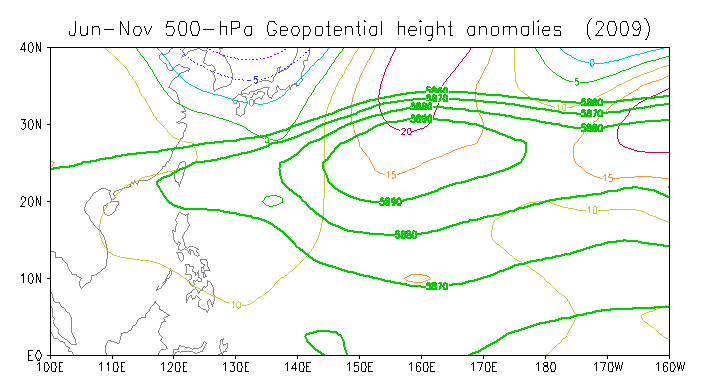
for the number of typhoons. On the other hand, the June-November 500-hPa
geopotential height shows positive anomalies over the subtropical WNP,
indicating a stronger than normal subtropical high (Fig. 3).
Such atmospheric conditions are therefore less favourable for TC genesis and
this partly explains the slightly below-normal TC activity. Indeed, the
predictor related to the subtropical high gave the better predictions (predicted
number of TCs with at least tropical storm intensity being 27 and number of
typhoons being 16) than the ENSO predictors.
It should also be noted that during the past
five decades, the TC activity exhibited a significant interdecadal variation,
with the active periods of 1960-76 and 1989-97 and the inactive periods of
1977-1988 and 1998-2008. The
inactive TC period 1998–2008 appears to continue into 2009.
The number of tropical storms and typhoons is below the climatological mean in
the 2009 TC season, which is the
10th out of the last 12 years since 1998 with a below-normal TC
activity (Fig. 1).
2)
TC landfall
in South China
The number of TCs making landfall along the
coast of South China was 4 in the early season, 3 in the late season, 6 in the
main season, and 7 in the whole season (Table 1). The
prediction for the early season was perfect. However, the predictions for the
late and main seasons, even if TC Parma, which had taken on a highly unusual
track of looping around the northern tip of the Philippines, were not
considered, had underestimated the number of landfalling TCs, which also led to
an underestimation of the predicted value for the whole season.
Since the
error is most prominent in the late season, it is worth studying the atmospheric
patterns during that period. In our forecasts issued in April and June, the year
2009 was expected to be an El Niño year, which according to
Goh and Chan (2009b), is supposed to see below-normal
number of TCs making landfall in South China. However, as mentioned above, the
atmospheric patterns are not typical of an El Niño year. In addition to the
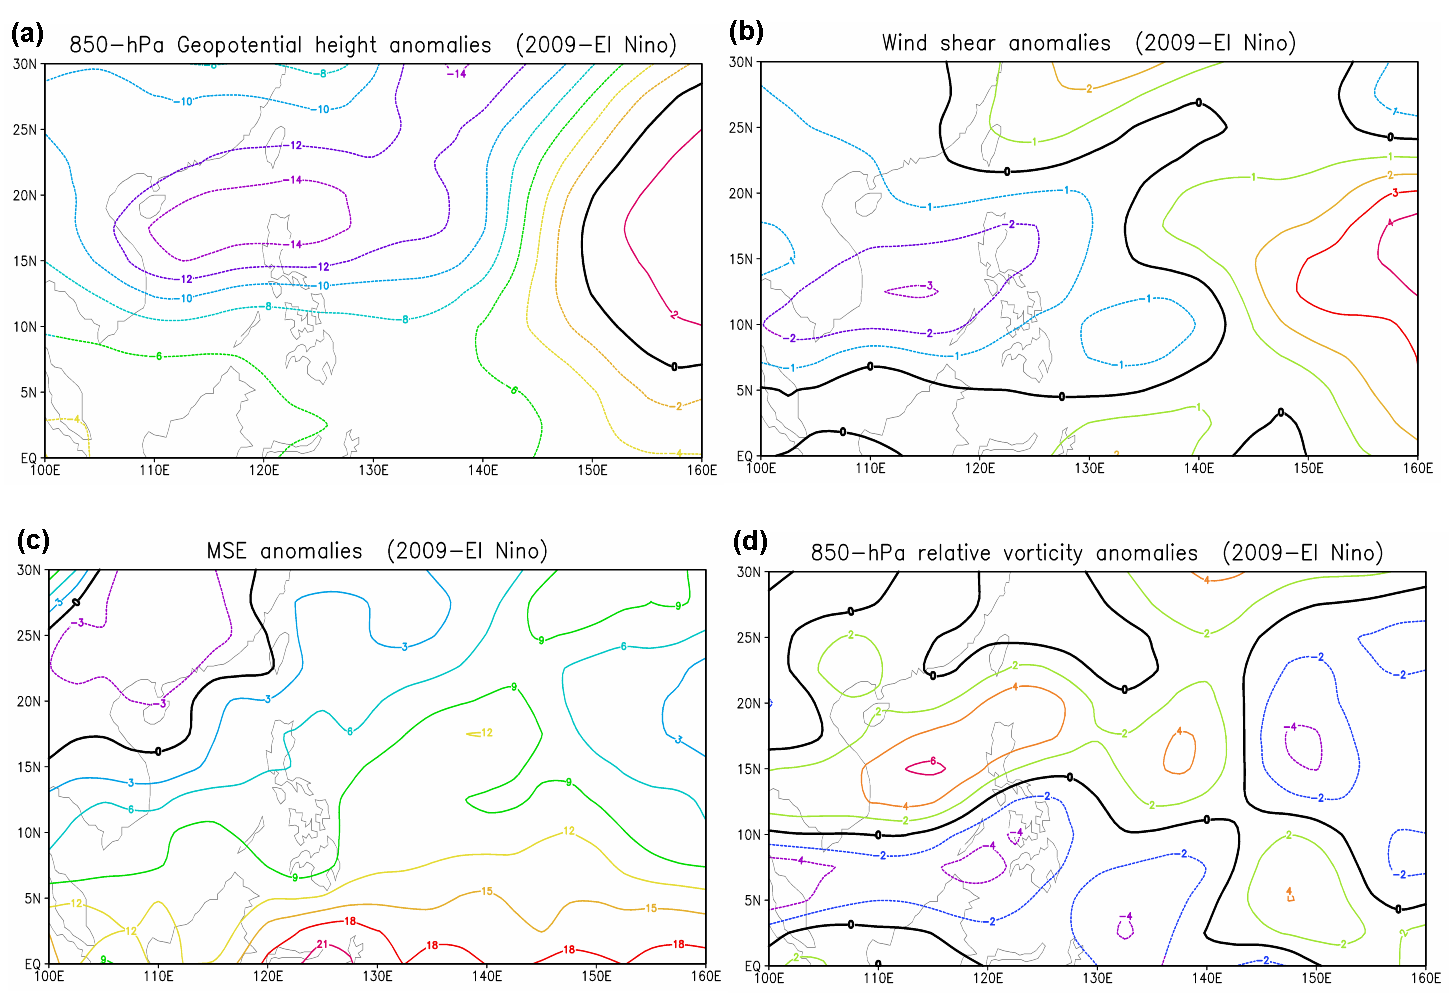
850-hPa flow pattern found to be different from that in a typical El Niño year,
the formation factors of 850-hPa geopotential height (Fig. 4a) and 200-850
vertical wind shear (Fig. 4b) both show negative anomaly relative to the average
during El Niño years in the South China Sea and around the Philippines, while
both 1000-500-hPa moist static energy (Fig. 4c) and 850-hPa vorticity (Fig. 4d)
show positive anomaly. These factors are included in the current prediction
scheme (Goh and Chan 2009a), and are conditions
favourable for the formation of TCs, and thus lead to more TCs making landfall
along the coast of South China. Therefore the underestimation of this year’s
late season forecast appears to be related to the atypical situation of the
atmospheric patterns compared to those during typical El Niño years.
References
Chan, J.
C. L., J. E. Shi and C. M. Lam, 1998: Seasonal forecasting of tropical cyclone
activity over the western North Pacific and the South China Sea.
Weather Forecasting, 13, 997-1004.
Abstract
Chan, J.
C. L., J. E. Shi and K. S. Liu, 2001: Improvements in the seasonal forecasting
of tropical cyclone activity over the western North Pacific. Weather
Forecasting, 16, 491-498.
Abstract
Goh, A. Z. C., and J. C. L. Chan,
2009a: An improved statistical scheme for the prediction of tropical cyclones
making landfall in South China. Submitted to Weather and Forecasting.
Goh, A. Z. C., and J. C. L.
Chan, 2009b: Interannual and interdecadal variations of tropical cyclone
activity in the South China Sea. International Journal of
Climatology,
DOI: 10.1002/joc.1943.
Liu, K. S.
and J. C. L. Chan, 2003: Climatological
characteristics and seasonal forecasting of tropical cyclones making landfall
along the South China coast.
Monthly Weather Review,
131, 1650-1662.
Abstract
|
Table 1. |
Forecasts of TC activity in 2009 issued in April and
June. The observed activity based on both the JTWC and RSMC-Tokyo
warnings and the normal values are also shown. |
|
2009 |
Forecast |
Observed |
Normal |
|
|
April |
June |
JTWC |
RSMC |
|
|
Entire western North Pacific |
|
No. of TCs |
31 |
30 |
29 |
--- |
31 |
|
No. of TCs with at least tropical storm intensity |
27 |
27 |
25 |
22 |
27 |
|
No. of typhoons |
18 |
19 |
14 |
13 |
17 |
|
Landfall in South China |
|
Early
Season (May to Aug) |
4 |
--- |
4 |
--- |
3 |
|
Late
Season (Sep to Dec) |
0 |
--- |
3 |
--- |
2 |
|
Main
Season (Jul to Dec) |
--- |
3 |
6 |
--- |
4 |
|
Whole
Season (May to Dec) |
4 |
--- |
7 |
--- |
5 |
|
Table 2. |
2009 summary of tropical
cyclones over the western North Pacific
and tropical
cyclones making landfall in
South China. |
|
|
Tropical
cyclones |
Tropical
cyclones with at least tropical storm intensity |
Tropical
cyclones with typhoon intensity |
Tropical
cyclones
making landfall in South China |
|
|
01. Kujira
02. Chan-hom
03. Linfa%
04. Nangka
05. Soudelor
06. 06W
07. Molave
08. Goni
09. Morakot
10. Etau
11. Maka*
12. Vamco
13. Krovanh
14. 02C*
15. Dujuan
16. Mujigae
17. Choi-wan
18. Koppu
19. Ketsana
20. 18W#
21. Parma
22. Melor
23. Nepartak
24. Lupit
25. Mirinae
26. 24W
27. 25W#
28. Nida
29. 27W |
01. Kujira
02. Chan-hom
03. Linfa%
04. Nangka
05. Soudelor
06. Molave
07. Goni
08. Morakot
09. Etau
10. Maka*
11. Vamco
12. Krovanh
13. Dujuan
14. Mujigae
15. Choi-wan
16. Koppu
17. Ketsana
18. 18W#
19. Parma
20. Melor
21. Nepartak
22. Lupit
23. Mirinae
24. 25W#
25. Nida
|
01. Kujira
02. Chan-hom
03. Linfa%
04. Molave
05. Morakot
06. Vamco
07. Choi-wan
08. Koppu
09. Ketsana
10. Parma
11. Melor
12. Lupit
13. Mirinae
14. Nida
|
01. Nangka
02. Soudelor
03. Molave
04. Goni
05. Mujigae
06. Koppu
07. Parma
|
|
Total number |
29 (JTWC) |
25 (JTWC) /
22 (RSMC) |
14 (JTWC) /
13 (RSMC) |
7 |
|
Predicted number
(issued in April) |
31 |
27 |
18 |
|
|
Predicted number
(issued in June) |
30 |
27 |
19 |
|
# 18W and 25W were considered as having TS intensity by
JTWC but no name was given by RSMC Tokyo
* 02C and Maka formed over
the Central Pacific and moved into the western North Pacific.
% Linfa was considered by
JTWC as having reached typhoon intensity but not by RSMC Tokyo |
|
Table
3. |
Number of tropical storms and typhoons and
number of typhoons during the years after La Niña events. Orange and blue shadings indicate the
above-normal and below-normal TC activity respectively. |
|
|
El Niño Year |
Number of tropical storms and
typhoons |
Number of typhoons |
|
Active period |
1963 |
25 |
19 |
|
1965 |
34 |
21 |
|
1969 |
19 |
13 |
|
1972 |
30 |
22 |
|
1976 |
25 |
14 |
|
1991 |
30 |
20 |
|
1994 |
36 |
21 |
|
1997 |
31 |
23 |
|
|
|
|
|
|
Inactive period |
1982 |
26 |
19 |
|
1986 |
27 |
19 |
|
1987 |
24 |
18 |
|
2002 |
26 |
18 |
|
2004 |
30 |
21 |
|
2006 |
22 |
14 |
|
2009 |
25 |
14 |

Fig. 1.
|
Annual number of tropical storms and typhoons between 1960 and
2009. The horizontal line indicates the climatological mean. Red circle and
blue squares indicate the El Niño and
La Niña years respectively. |

|
Fig. 2. |
850-hPa
wind anomalies (vector) between June and November in 2009. Shadings indicate
the zonal wind (interval = 0.5 m s-1).
|

Fig. 3.
|
500-hPa geopotential height
anomalies between June and November in 2009. Thick contour indicates the
geopotential height (contour interval = 10 m)
³ 5860 m. |

|
Fig. 4. |
Differences in the late season (September-December) atmospheric fields
between 2009 and other El Niño years. (a)
850-hPa geopotential height (contour interval = 2 m), (b) 200-850 hPa vertical
wind shear (contour interval = 1 m s-1), (c) MSE (contour
interval = 3 x 10⁶
W m-2) and (d) 850-hPa relative
vorticity (contour interval =
2 x
10-6
s-1). |
|