|
2009 Updated Predictions of
(1) Seasonal Tropical Cyclone Activity over
the Western North Pacific, and
(2)
Number of Tropical Cyclones Making Landfall in South China
This is an update of the predictions of the annual number of tropical
cyclones (TCs) in the western North Pacific (WNP) and
the number of TCs making landfall in South
China
for 2009 that we issued on
20 April 2009.
These updates are made based on new information for the months of April and May
2009.
2. ENSO conditions in 2009
The oceanic and atmospheric conditions in the Pacific are now
in neutral status. The Niño3.4 and Niño4 indices in May are 0.27 and 0.32
respectively. At the same time, warming of the central and east equatorial
Pacific Ocean observed and may continue into the summer. A
summary of the various ENSO
model forecasts from different climate centres
suggests that most of them predict a warm condition in 5 to 7 months time (Table.
1). Out of the 7 forecasts, 5 suggest the possible development
of an El Niño event. It therefore appears that for the rest of 2009, a
development of El Niño conditions is possible. In other words, 2009 will likely
be an El Niño year.
3. Predictions for the WNP
For the total number of TCs, the
prediction from the index of India-Burma trough gives an decrease in TC
number (from 30 to 28) compared with 30 in the April forecast (cf.
Tables 2a and 2b). No change occurs using the
other predictors and the final predicted number therefore decreases from 31
to 30.
No significant change is found on the predicted number of tropical storms and
typhoons (Table 2). All the predictors give
numbers similar to those in the April forecast and therefore the final predicted
number is still 27.
For the number of typhoons, the
prediction from the Niño3.4 predictor gives an increase in TC number (from 20 to
22). This is probably related to the recent warming of the equatorial
North Pacific.
An increase (from 17 to 18) is
also found based on the index of
India-Burma trough
and no change occurs using other predictors. The
final predicted number therefore increases from 18 to 19.
As an El Niño event could occur in 2009 as
suggested in section 2, it is useful to discuss the TC activity during El
Niño years. During
the past five decades, the TC activity exhibited a significant interdecadal
variation, with the active periods of 1960-76 and 1989-97 and the inactive
periods of 1977-1988 and 1998-2008 (Fig. 1). The
variations of the TC activity during El
Niño years
are quite
different in the active and inactive periods (Table 3).
Since the inactive TC period 1998–2008 will likely to continue into 2009, it is
more appropriate to
discuss the TC activity during El
Niño years occurring in the
inactive periods. The number of tropical storms and typhoons tends to be
normal or below-normal except for 2004 (Table 3).
However, the number of typhoons tends to be normal or above-normal except for
2006 (Table 3).
Therefore, the 2009 TC season will likely to be
normal, with the possibility of a slightly below-normal
number of tropical storms and
typhoons and a
slightly above-normal
number of typhoons,
which is consistent with our forecast.
The predictor related to the
subtropical high (HWNP) continues to suggest a near-normal
to slightly below-normal TC activity, which is probably related to the
stronger-than-normal subtropical high over the eastern part of the WNP (Fig.
2).
4.
Predictions for
the number of landfalling TCs over South China
The number of TCs making landfall on the coast of Southern
China between July and December is forecast to be 3, slightly below the normal
number of 4. The ENSO forecast calls for El Niño conditions in the latter
part of this year, which, as
suggested in section 2,
would cause fewer TCs to form or be steered into the SCS, especially during the
late season. This would explain the slightly below-normal forecast for July to
December landfalling TCs.
Summary of predictions
With these changes, it is expected that the overall TC activity and the number
of tropical storms and typhoons are likely to be near-normal but the number of
typhoons is likely to be slightly above-normal (See Table 4).
The number of TCs making landfall on the coast of Southern
China between July and December tends to be slightly below-normal.
|
MODEL /
GROUP |
2-4 MONTHS
(Jul to Sep 09) |
5-7 MONTHS
(Oct to Dec 09) |
|
POAMA
(run at Bureau of Met) |
Warm |
Warm |
|
System 3
ECMWF |
Warm |
Warm |
|
GloSea
UK Met Office |
Neutral |
Not Available |
|
CFS
NCEP |
Warm |
Warm |
|
CGCMv1
GMAO/NASA |
Warm |
Warm |
BCC CGCM
BCC/CMA |
Neutral |
Warm |
|
JMA-CGCM02
Japan Met. Agency |
Neutral |
Neutral |
|
Table 2. |
Forecasts from various predictors and the weighted
average of the forecasts. |
(a) April Forecast
|
Entire western North Pacific |
|
All TC |
|
HWNP |
HIB |
NINO4 |
|
Final forecast |
Normal
|
|
Prediction |
30 |
30 |
33 |
|
31 |
31 |
|
Weight |
0.65 |
0.66 |
0.70 |
|
|
|
|
|
Tropical storms and typhoons |
|
HWNP |
HIB |
WP |
NINO3.4 |
Final forecast |
Normal
|
|
Prediction |
27 |
26 |
26 |
27 |
27 |
27 |
|
Weight |
0.68 |
0.67 |
0.62 |
0.67 |
|
|
|
|
Typhoons |
|
HWNP |
HIB |
WP |
NINO3.4 |
ESOI |
Final forecast |
Normal
|
|
Prediction |
16 |
17 |
19 |
20 |
19 |
18 |
17 |
|
Weight |
0.57 |
0.59 |
0.52 |
0.73 |
0.64 |
|
|
|
(b) June Forecast
|
Entire western North Pacific |
|
All TC |
|
HWNP |
HIB |
NINO4 |
|
Final forecast |
Normal
|
|
Prediction |
30 |
28 |
33 |
|
30 |
31 |
|
Weight |
0.74 |
0.69 |
0.70 |
|
|
|
|
|
Tropical storms and typhoons |
|
HWNP |
HIB |
WP |
NINO3.4 |
Final forecast |
Normal
|
|
Prediction |
27 |
26 |
26 |
27 |
27 |
27 |
|
Weight |
0.68 |
0.67 |
0.62 |
0.67 |
|
|
|
|
Typhoons |
|
HWNP |
HIB |
WP |
NINO3.4 |
ESOI |
Final forecast |
Normal
|
|
Prediction |
16 |
18 |
19 |
22 |
19 |
19 |
17 |
|
Weight |
0.61 |
0.71 |
0.66 |
0.75 |
0.64 |
|
|
|
| |
| HWNP |
Index of the westward extent of
the subtropical high over the western North Pacific |
| HIB |
Index of the strength of the
India-Burma trough (15o-20oN, 80o-120oE) |
| WP |
Primary mode of low-frequency
variability over the North Pacific |
| NINO3.4 |
Sea surface temperature (SST)
anomalies in the NINO3.4 region (5oS-5oN,
170o-120oW) |
| NINO4 |
Sea surface temperature (SST)
anomalies in the NINO4 region (5oS-5oN, 160oE-150oW) |
| ESOI |
Equatorial Southern Oscillation
Index (Equatorial SOI)
Equatorial Eastern Pacific SLP - Indonesia SLP (standardized anomalies) |
|
|
Table 3. |
Number of tropical storms and typhoons and number of typhoons in an El Niño
year. Red
and blue shadings indicate the above-normal and below-normal TC activity
respectively. |
|
|
El Niño
Year |
Number of tropical storms and typhoons |
Number of typhoons |
|
Active period |
1963 |
25 |
19 |
|
1965 |
34 |
21 |
|
1969 |
19 |
13 |
|
1972 |
30 |
22 |
|
1976 |
25 |
14 |
|
1991 |
30 |
20 |
|
1994 |
36 |
21 |
|
1997 |
31 |
23 |
|
|
|
|
|
|
Inactive period |
1982 |
26 |
19 |
|
1986 |
27 |
19 |
|
1987 |
24 |
18 |
|
2002 |
26 |
18 |
|
2004 |
30 |
21 |
|
2006 |
22 |
14 |
|
|
Forecast |
Normal |
|
Entire western North Pacific |
|
All
TC |
30 (near-normal) |
31 |
|
Tropical storms and typhoons |
27 (near-normal) |
27 |
|
Typhoons |
19 (slightly above-normal) |
17 |
|
Landfall in South China |
|
Main season (July
to December) |
3 (slightly below-normal) |
4 |
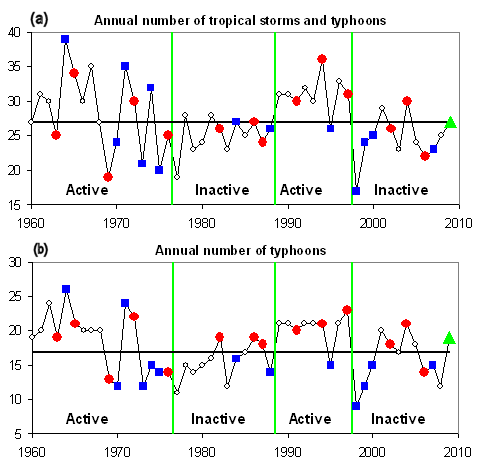
Fig. 1.
|
Time
series of (a) the annual number of tropical storms and typhoons and (b) the
annual number of typhoons. Red circle and blue squares indicate the El Niño
and La Niña years respectively. The green
triangle indicated the predicted number in 2009. The thick horizontal line
indicates the normal number of tropical storms and typhoons. The green
vertical lines divide the years 1960-2008 into the active and inactive
periods. |
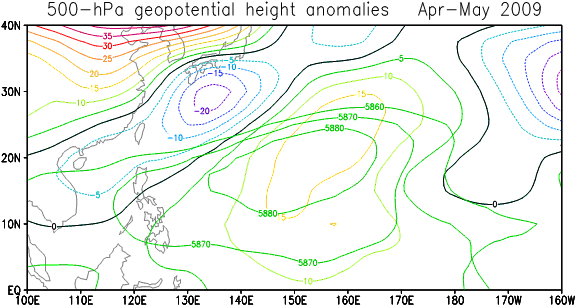
Fig. 2.
|
500-hPa geopotential height anomalies between April and May in 2009. Thick
contour indicates the geopotential height (contour interval = 10 m)
³
5860 m. |
|

