|
Verification of Forecasts of Tropical Cyclone Activity over the Western
North Pacific in 2008
|
1. Introduction
|
|
Issued on 16 Jan 2009 |
Since 2000, City University of Hong Kong has been issuing
real-time predictions of the annual number of tropical cyclones (TCs) affecting
the western North Pacific (WNP). Verifications of the predictions have
shown that the predictions are mostly correct within the error bars.
These are all
statistical predictions with predictors drawn from a large group of indices that
represent the atmospheric and oceanographic conditions in the previous year up
to the spring of the current year. The most prominent ones include the
proxies for El Niño/Southern Oscillation (ENSO), the extent of the subtropical
ridge, and the intensity of the India-Burma trough. Details can be found
in
Chan et al. (1998, 2001)
and
Liu and
Chan (2003).
2. Verification of the 2008
forecasts
a. Summary of the forecasts issued
Our April forecasts (issued on
18 April 2008)
suggested “slightly
above-normal activity for all the categories”.
A similar forecast was made on
24 June 2008.
Detailed numbers are summarized in
Table 1.,
together with the observed numbers based on the warnings from JTWC and the
Tokyo
Regional Specialised Meteorological Center (RSMC)
(Table 2.).
Disagreements occurred among the warning centres on the intensity of some of the
systems. Four systems (01W, 14W, 16W and 22W) were classified by the JTWC
as having reached tropical storm intensity but were not named by the RSMC.
On the other hand, RSMC issued tropical storm warning for one system (Phanfone)
but no warning was given by JTWC. In addition, Halong was considered by
JTWC as having reached typhoon intensity but not by RSMC Tokyo
b.
Verification and discussion
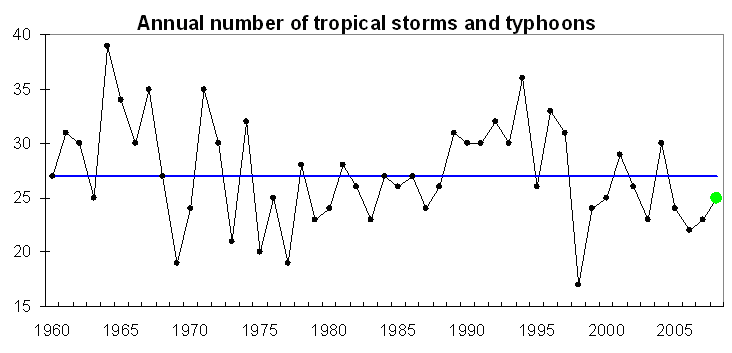
The TC activity in 2008 over the
WNP was below-normal (Fig. 1), with 25 TCs reaching at least
tropical storm intensity and 12 TCs reaching typhoon intensity (based on JTWC,
Table 2.). The overall TC intensity is also lower. The number of
typhoons is 5 less than the normal number (the normal being 17) but the number
of tropical storms and typhoons is only 2 less than the normal number (the
normal being 27). Our forecasts from both April and June over-estimated
the TC activity especially for the number of typhoons. This is the first time
that our forecasts were incorrect, the possible reasons of which are discussed
below.
The mean genesis location shifted westward and no storm formed over the tropical
WNP east of 150oE, which is rather unusual if 2008 is considered to
be an ENSO-neutral year. However, as discussed below, the atmospheric
conditions (see Figs. 2 and
3) were very much like that of, or a continuation of, a La
Niña event.
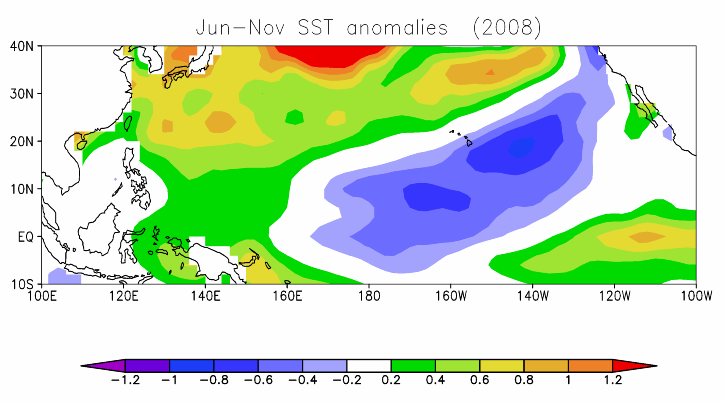
The ENSO is generally considered to be in its
neutral status during the TC season of 2008. The mean Jun-Nov Nino4 index is
-0.31, indicating the slightly cooler-than-normal SSTs over the equatorial
Central Pacific (Fig. 2). However, a large area of
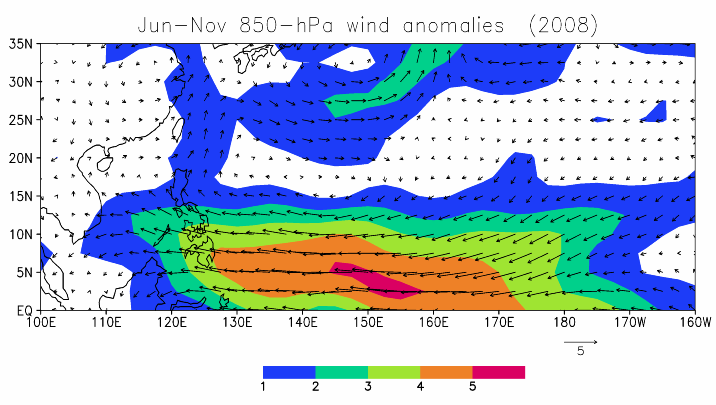
negative SST anomalies is found over the subtropical Pacific east of 170oE.
Correspondingly, easterly anomalies are found over the entire tropical WNP, with
the maximum amplitude near 150oE (Fig. 3).
As a result, the monsoon trough is weaker. Therefore, atmospheric and oceanic
conditions are not favorable for TC genesis and these partly explain the
below-normal TC activity in the year of 2008.
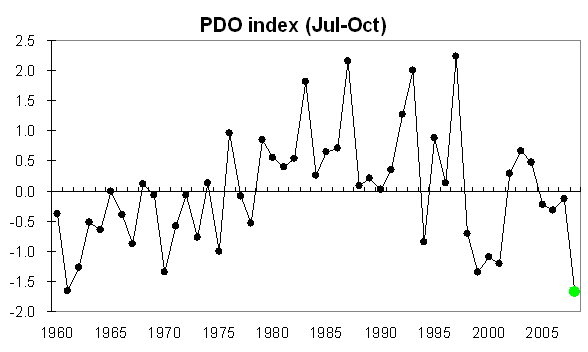
It is worth to note that the PDO is in its negative
phase during the TC season of 2008. The mean PDO index averaged between
June and November is the lowest in the last five decades (Fig. 4).
The unfavorable atmospheric and oceanic conditions for TC genesis may be related
to this strong negative PDO event. It is therefore of interest to
investigate the TC activity in a year after a La Nina event and under the
background of a strong negative PDO event. During the period of 1960-2008,
five such TC seasons (1975, 1999, 2000 and 2008) are found (Table 3). Out
of these seasons, four are associated with slightly below-normal or below-normal TC activity. For the other TC seasons without a strong negative PDO
background (i.e. either a weak or positive PDO signal), six of the eight seasons
are associated with above-normal TC activity, which is a main reason for our
forecasts. The strong negative PDO in 2008 may be one of the factors
responsible for the below-normal TC activity. Our forecast scheme does not
include the PDO predictor and this may be the reason for the over-estimation of
the TC activity in 2008. Further research into the effect of PDO is necessary
in future forecasts.
References
Chan, J.
C. L., J. E. Shi and C. M. Lam, 1998: Seasonal forecasting of tropical cyclone
activity over the western North Pacific and the South China Sea.
Weather Forecasting, 13, 997-1004.
Abstract
Chan, J.
C. L., J. E. Shi and K. S. Liu, 2001: Improvements in the seasonal forecasting
of tropical cyclone activity over the western North Pacific. Weather
Forecasting, 16, 491-498.
Abstract
Liu, K. S.
and J. C. L. Chan, 2003: Climatological
characteristics and seasonal forecasting of tropical cyclones making landfall
along the South China coast.
Monthly Weather Review,
131, 1650-1662.
Abstract
|
Table 1. |
Forecasts of TC activity in 2008 issued in April and
June. The observed activity based on both the JTWC and RSMC-Tokyo
warnings and the normal values are also shown. |
|
2008 |
Forecast |
Observed |
Normal |
|
|
April |
June |
JTWC |
RSMC |
|
|
No. of TCs |
33 |
33 |
28 |
--- |
31 |
|
No. of TCs with at least tropical storm intensity |
30 |
30 |
25 |
22 |
27 |
|
No. of typhoons |
19 |
19 |
12 |
11 |
17 |
|
Table 2. |
2008 summary of tropical
cyclones over the western North Pacific. |
|
|
Tropical
cyclones |
Tropical
cyclones with at least tropical storm intensity |
Tropical
cyclones with typhoon intensity |
|
|
01. 01W#
02. Neoguri
03. Rammasun
04. Matmo
05. Halong %
06. Nakri
07. Fengshen
08. Kalmaegi
09. Fung-wong
10. Kammuri
11. Phanfone*
12. 11W
13. Vongfong
14. Nuri
15. 14W#
16. Sinlaku
17. 16W#
18. 17W
19. Hagupit
20. Jangmi
21. Mekkhala
22. Higos
23. 22W#
24. Bavi
25. Maysak
26. Haishen
27. Noul
28. Dolphin |
01. 01W#
02. Neoguri
03. Rammasun
04. Matmo
05. Halong %
06. Nakri
07. Fengshen
08. Kalmaegi
09. Fung-wong
10. Kammuri
11. Phanfone*
12. Vongfong
13. Nuri
14. 14W#
15. Sinlaku
16. 16W#
17. Hagupit
18. Jangmi
19. Mekkhala
20. Higos
21. 22W#
22. Bavi
23. Maysak
24. Haishen
25. Noul
26. Dolphin
|
01. Neoguri
02. Rammasun
03. Halong %
04. Nakri
05. Fengshen
06. Kalmaegi
07. Fung-wong
08. Nuri
09. Sinlaku
10. Hagupit
11. Jangmi
12. Dolphin
|
|
Total number |
28 (JTWC) |
25 (JTWC) / 22 (RSMC) |
12 (JTWC) / 11 (RSMC) |
|
Predicted number
(issued in April) |
33 |
30 |
19 |
|
Predicted number
(issued in June) |
33 |
30 |
19 |
|
# 01W, 14W, 16W and 22W were
considered as having TS intensity by JTWC but no name was given by RSMC
Tokyo
* Phanfone was considered by RSMC Tokyo as having reached TS intensity but
no warning was given by JTWC.
% Halong was considered by JTWC as having reached typhoon intensity
but not by RSMC Tokyo |
|
Table
3. |
Number of tropical storms and typhoons and
number of typhoons during the years after La Niña events. Orange and blue shadings indicate the
above-normal and below-normal TC activity respectively. |
|
|
PDO
(Jul-Oct) |
Niño3.4
(Jul-Oct) |
No. of storms
and typhoons |
No. of
typhoons |
ENSO
status |
|
Years with strong negative PDO |
|
2008 |
-1.67 |
-0.05 |
25 |
12 |
Neutral |
|
1999 |
-1.35 |
-0.94 |
24 |
12 |
La Niña |
|
2001 |
-1.21 |
0.08 |
29 |
20 |
Neutral |
|
2000 |
-1.10 |
-0.42 |
25 |
15 |
La Niña |
|
1975 |
-1.00 |
-1.24 |
20 |
14 |
La Niña |
|
|
|
Others years |
|
1971 |
-0.59 |
-0.58 |
35 |
24 |
La Niña |
|
1972 |
-0.08 |
1.38 |
30 |
22 |
El Niño |
|
1965 |
-0.01 |
1.34 |
34 |
21 |
El Niño |
|
1974 |
0.13 |
-0.49 |
32 |
15 |
La Niña |
|
1996 |
0.14 |
-0.20 |
33 |
21 |
Neutral |
|
1989 |
0.21 |
-0.36 |
31 |
21 |
Neutral |
|
1985 |
0.65 |
-0.35 |
26 |
17 |
Neutral |
|
1976 |
0.96 |
0.51 |
25 |
14 |
El Niño |
|
|
|
|
Normal: 27 |
Normal: 17 |
|

Fig. 1.
|
Annual
number of tropical storms and typhoons in the western North Pacific between
1960 and 2008. The horizontal line indicates the climatological mean.
The green circle indicates the year of 2008. |

|
Fig. 2. |
SST
anomalies between June and November in 2008.
|

Fig. 3.
|
850-hPa
wind anomalies (vector) between June and November in 2008. Shadings indicates
the wind speed (interval = 1 m s-1). |

|
Fig. 4. |
Time series of the
July-October PDO index between 1960 and 2008. The green circle indicates the year of 2008. |
|